IPCC Exclusions And Inclusions Of Climate Mechanisms Are Both Failures
They only consider human influence since pre-industrial times, approximately 1750 A.D. but don’t explain or account for natural variability because their objective is link human industry with warming.
Dr. Tim Ball
Charles Lyell, whose work Principles of Geology was a great influence on Charles Darwin, said, “The present is the key to the past”.
The inverse is equally valid and only when climate science can document and explain the past will we know what impact humans are having.
Remember, the Intergovernmental Panel on Climate Change (IPCC) only looks at human impact being restricted by their definition of climate change.
“The definition of climate change the United Nations Framework Convention on Climate Change (UNFCCC), in its Article 1, defines climate change as: ‘a change of climate which is attributed directly or indirectly to human activity that alters the composition of the global atmosphere and which is in addition to natural climate variability observed over comparable time periods’. The UNFCCC thus makes a distinction between climate change attributable to human activities altering the atmospheric composition, and climate variability attributable to natural causes.”
Notice the very important and restrictive phrase, “which is in addition to natural climate variability observed over comparable time periods”. They only consider human influence since pre-industrial times, approximately 1750 A.D. but don’t explain or account for natural variability because their objective is link human industry with warming. Conveniently, global temperatures rose naturally from the nadir of the Little Ice Age in the 1680s. It is impossible to determine what portion of that change was due to CO2, let alone the human portion. Yet, we’re told they’re 90 percent certain that human CO2 causes almost all temperature change since the 1950s. It’s a conclusion a knowledgeable graduate thesis committee would reject completely; indeed, a supervisor of any ability wouldn’t allow it to reach that level. It’s a conclusion that should fail as a Grade XII paper.
Long Term Climate Change
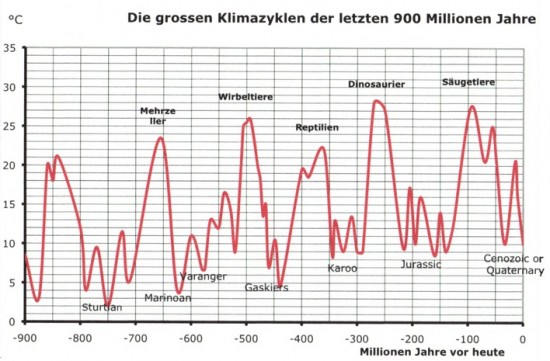
The IPCC is studying 250 years or just 0.000027 percent of the 900 million years of estimated temperature change in Figure 1. Temperatures range from 28°C to 2°C with apparently regular oscillations about every 150 million years. There’s a gradual warming over the record. Warm periods stand out separated by cool stretches that correlate with known ice ages. Crudeness of the graph eliminates short-term oscillations, such as the sunspot cycle warming from 1680 to 2000.
Scientists like Bernard Kuhn and James Hutton, had noticed evidence of a recent ice age in the Alps in their travels at the end of the 18th century. However, it was a paper by Louis Agassiz to a conference in 1837 that led to the overthrow of established geology. Frustrated by the derision, Agassiz dragged attendees out into the mountains and showed them the evidence. The debate lasted 25 years and changed geology from the philosophy of Neptunism that landscape was shaped by the biblical flood to Uniformitarianism.
Figure 1: Estimated global temperature over 900 million years. Source: Dr Dietrich Kolle.
Ice Ages
Agassiz identified the Pleistocene Ice Age that began about 2.5 million years ago. Between then and now ice sheets built up and receded four times; the most recent recession began 18,000 years ago. Few are aware that there were at least seven pre-Pleistocene ice ages and some argue nine. Evidence of previous glaciations is erased by subsequent glaciations and ongoing erosion.
Advance and retreat of ice in the Pleistocene is generally explained by changes in earth’s orbit, the Milankovitch Effect, but the cycles in Figure 1 are too long for that explanation. Some proposed they’re related to periods of intense volcanic activity, others that they were caused by continental drift and periods of mountain building. Neither fit the chronology.
In 1959, professor Edward Ney proposed that if climate sensitivity were related to changes in density of tropospheric ions, it would indicate a solar climate link. The most likely explanation for changes in tropospheric ionization is variation in the rate of cosmic rays entering the atmosphere. The question is what causes the variation?
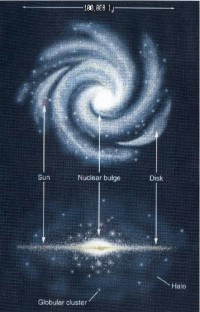
Most are familiar with earth’s orbit around the sun, but few know the sun orbits the Milky Way galaxy (Figure 2). The sun passes through the spiral arms of the galaxy. Density of cosmic ray sources is not uniform but is 2.5 times higher in the spiral arms.
Figure 2: Plan view and cross-section of the Milky Way showing Sun’s position. Source:
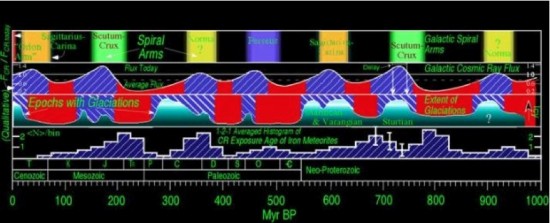
As Nir Shaviv explains, The main result of this research, is that the variations of the flux, as predicted from the galactic model and as observed from the Iron meteorites is in sync with the occurrence of ice-age epochs on Earth. The agreement is both in period and in phase: (1) The observed period of the occurrence of ice-age epochs on Earth is 145 ± 7 Myr (compared with 143 ± 10 Myrs for the Cosmic ray flux variations), (2) The mid point of the ice-age epochs is predicted to lag by 31 ± 8 Myr and observed to lag by 33 ± 20 Myr.
Figure 3 shows Shaviv’s plot of the relationship between the various events over 1 billion years. It’s a correlation with a cause and effect, the variation in cosmic radiation because of passage through the galactic arms of the Milky Way.
Figure 3: “The top panel describes our passages through galactic spiral arms. The second panel describes the predicted cosmic ray flux and the predicted occurrence of ice-age epochs. The third panel describes the actual occurrence of ice-age epochs. The fourth panel indirectly describes the variable cosmic ray flux. Due to the fact that the cosmic ray flux is the “clock” used to exposure date meteorites, the meteoritic ages are predicted to cluster around periods when the “clock” ticks slower, which is when the cosmic ray flux was lowest, as is seen in the data.” Source.
Major Mechanisms Of Climate Change Ignored By IPCC
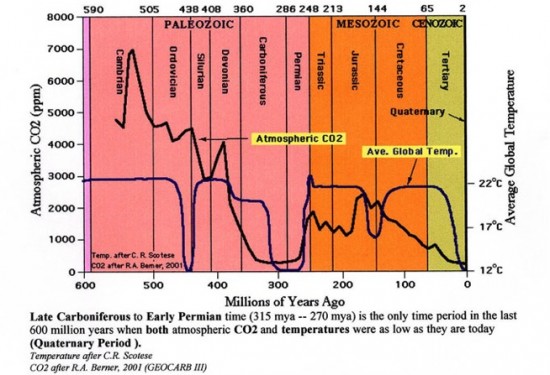
The scale of these cosmic radiation changes does not fit the 250-year study of the IPCC. However, the cyclical changes of the Milankovitch effect are relevant, but not included in the IPCC models. The cyclical relationship between solar activity, cosmic radiation, low cloud and global temperature are not included. Rather they include relationships that don’t exist. Most important of these is their claim that a CO2 increase results in a temperature increase. It doesn’t in the short medium or long term as the evidence for 600 million years in Figure 4 shows.
Figure 4: No correlation between CO2 and temperature so no cause and effect.
___________________________________________________________
Dr. Tim Ball is a renowned environmental consultant and former climatology professor at the University of Winnipeg. Dr. Ball employs his extensive background in climatology and other fields as an advisor to the International Climate Science Coalition, Friends of Science and the Frontier Centre for Public Policy.
Dr. Ball can be reached at: Letters@canadafreepress.com
Older articles by Dr. Tim Ball
Help Make A Difference By Sharing These Articles On Facebook, Twitter And Elsewhere:


